(253) 302-4847  ·  Tacoma      (253) 844-4289  ·  Lakewood

Blog  ·  March 10 2020

How's the Market? March 2020

Where are the Opportunities?

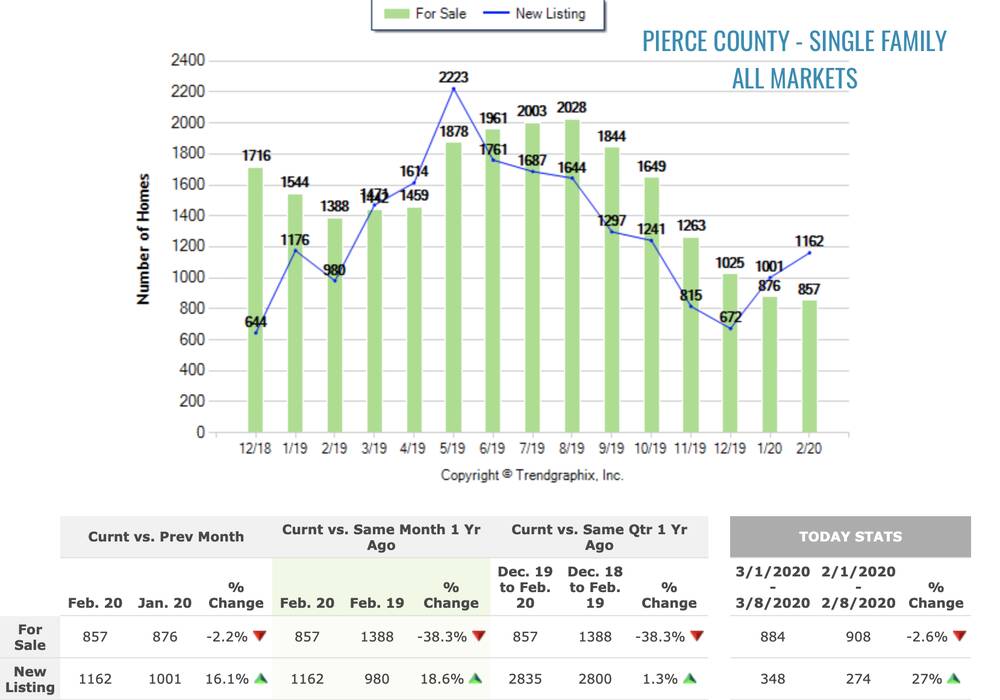
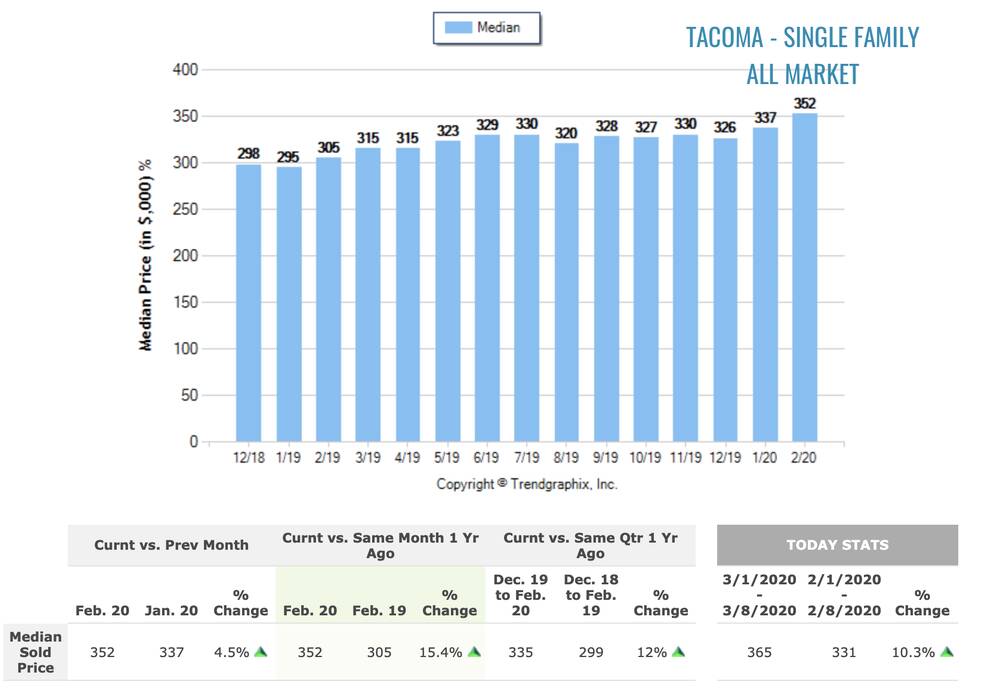
By now, you don’t need me to tell you the Pierce County housing market is on fire… up until this point in the year, we saw the market take off quicker than we have in years past, with inventory shortage being a primary driver. In the month of February, we saw the market adjust slightly, with more listings going on the market. This provided a few more options for buyers who had missed out on properties earlier in the year, and perhaps in 2019.

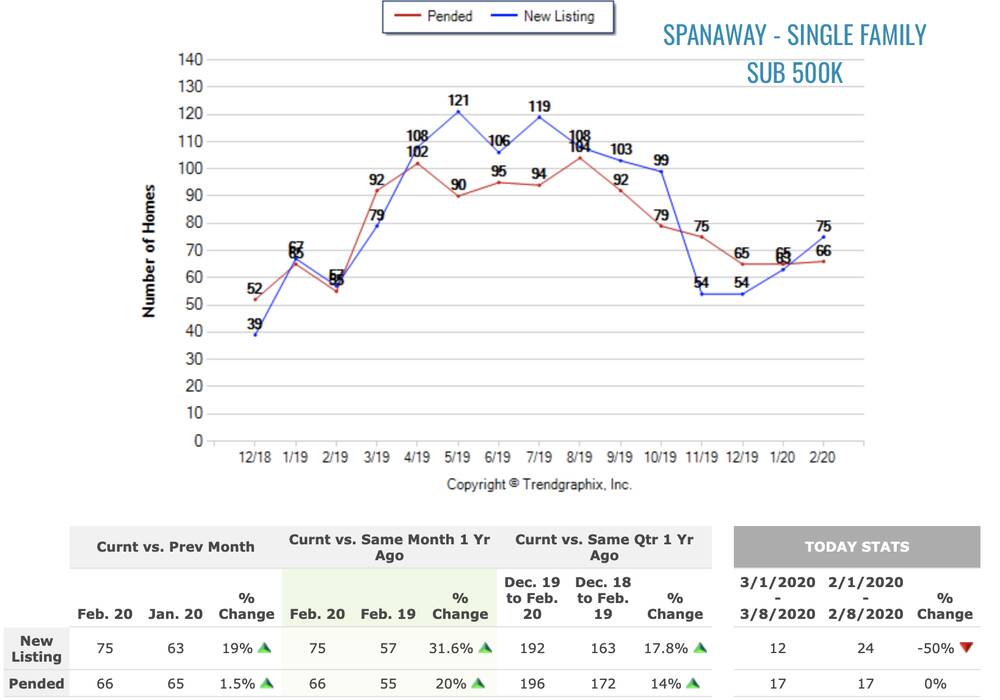
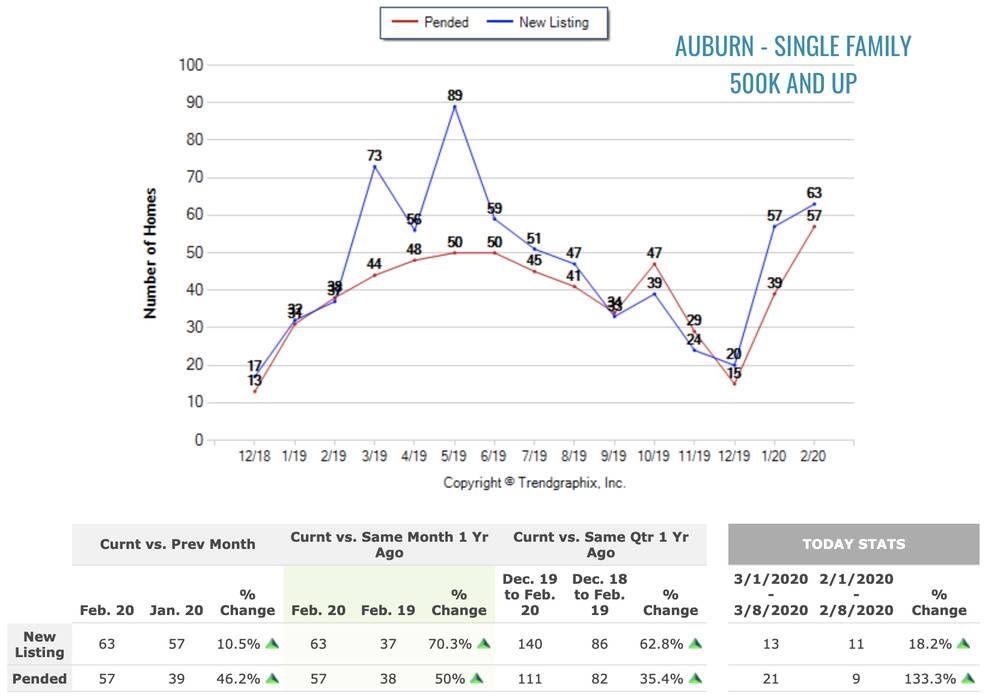
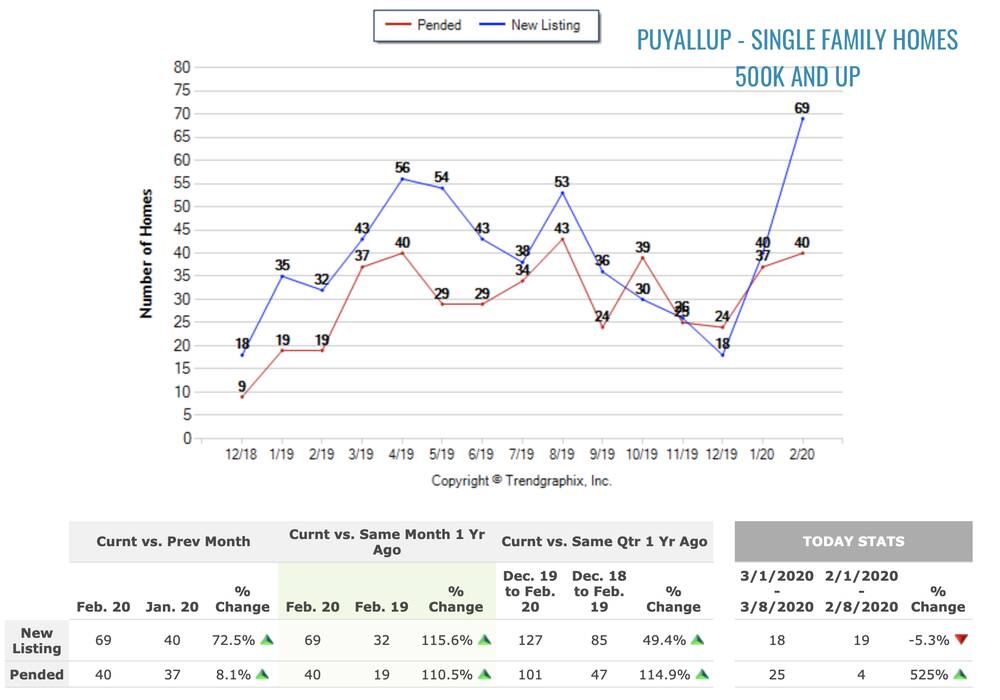
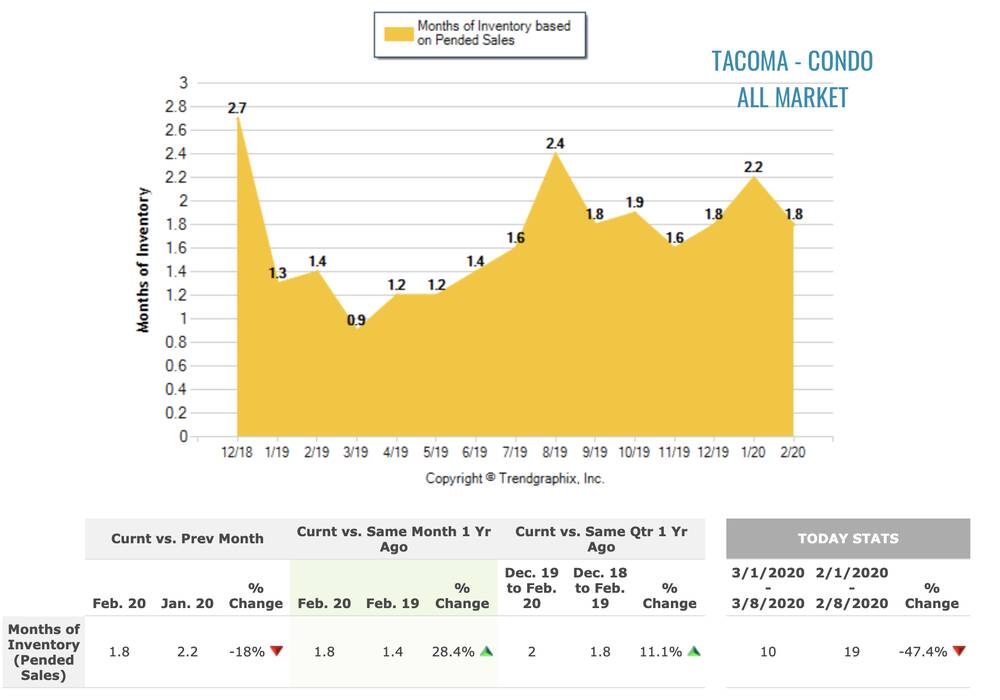
The questions I have thought about over the last month is, where are the opportunities? Let’s dive into the numbers to take at what took place in February of 2020.

PIERCE COUNTY

Despite the median price in Pierce County increasing from $380,000 to $400,000, we saw the number of new listings increase. Take a look at the graph below:

The blue line represents new listings. In Pierce County, we saw the new listings increase 16.1% from 1,001 in January to 1,162 in February. This is also an 18.6% increase in new listings from February 2019. Based on 2019 trends, we can anticipate that number continuing to increase leading up to April.

Where are some other opportunities around Pierce County? First, let’s take a look at the sub - $500,000 market in select areas where the number of new listings outnumbered the number of homes that went pending.

In Spanaway you can see the new listings have exceeded pending properties for the first time since October 2019. While Spanaway remains a strong sellers market, we can expect the new listings to continue to rise until April, and hopefully later. This provides opportunities for buyers.

Auburn is another area where we saw new listings exceed pending properties in the sub $500,000 market for the first time since August of last year. Not only is it a 51.8% change from last month, but year over year the amount of new listings is up 46.6% from 2019.

What about the over $500,000 market? Have they seen similar trends? Let’s take a look:

Typically the over $500,000 market is slower moving, and the inventory may sit a little longer than a home in the sub-$500,000 market. For the 3rd straight month in a row, the new listings exceeded the pending listings in Auburn. Year over year, the new listings increased 70% in Auburn in the over $500,000 market.

Puyallup is another area where the new listings skyrocketed from December 2019 to February of 2020. As you can see in the graph, the new listings shot up a dramatic 72.5%. In comparison to February of 2019, new listings saw a 115.6% increase. If you are in the market for new construction, based on these numbers Puyallup may be a place to consider.

Speaking of new construction, when thinking of new construction, Gig Harbor comes to mind. While the new listings haven’t exceeded the pendings, you can see the trend of new listings increasing monthly since December. Looking back to May of 2019, you can see the number of new listings skyrocketed. That caused the Gig Harbor market to flatten a little, with inventory available for potential buyers. Will 2020 see another dramatic increase rolling into May? Stay tuned…

TACOMA

Let’s take a look specifically at Tacoma, and how new listings have come on the market.

In this graph, you can see the number of homes for sale, which is down 35.4% from a year ago at the same time. The interesting thing to look at however, is the new listing trend from December of 2019. It’s important to note that in May of 2019, we had 603 new listings. Will we get there by May of 2020? There are some factors, but we’re already halfway there.

Now when breaking the markets down in Tacoma, you can see some discrepancies between the sub-$500,000 market and the $500,000 and up market… take a look:

In the sub $500,000 market in Tacoma, it’s still competitive… however did you know there were more new listings than pendings last month in this section of the market? Based on the 2019 trend moving into May of 2020, we anticipate and look forward to more new listings hitting the market.

As shown in the graph, the $500,000 and over market saw new listings rise 103.4% from 29 to 59 in January of 2020. Same time last year? A 168.2% change from 22 new listings to 59. Will new listings in the $500,000 and up market see it’s height in May 2020?

This graph is an illustration of the median price in Tacoma, all markets, over time. Year over year we are looking at a 15.4% increase in median price from February of 2019. Quite the jump considering what could be external factors (election year, COVID virus, etc).

How’s about a bonus graph for Tacoma? Another market we will spend more time on in the near future is the condominium market. Below, take a look at the months of inventory for condos in the Tacoma area. While still a strong sellers market, 1.8 months of inventory in our market seems like a lot!

SUMMARY

February numbers showed that while we are in need of more inventory, more homes hit the market and the gap in certain areas closed. If you are looking for more detailed information regarding any of these numbers, feel free to contact any one of our brokers for more detailed information on your area.

TERMINOLOGY KEY

Chances of Selling - Pending properties over active properties. When there are more pending than actives, your chances of selling increase due to less homes on the market. Conversely, if there are more active homes than pending, buyers have more options, thus a ‘buyer’s market.’

Median days on market - ‘Days on Market’ is just that; how many days your home has been on the market.

Median Sales Price - The reasoning to use the median is the same here, with the sales price being self explanatory. The sales price indicates the median price of homes

Why use the median?

We utilize the median so the data can tell a close to real story, and the data isn’t skewed by outliers. For example, if you have 5 homes and one has been on for 125 days, while the four others have been on for 15 days, the outlier of the bunch (property that sat for 125 days on market) doesn’t skew the data set.