Typically, in the Winter, the market slows as the days grow short and Buyers and Sellers take time to enjoy the holiday season. The Tacoma / Pierce County market seasonal trends, with a few notable exceptions. Let’s dive into the numbers!

Pierce county
As a whole in the month of December, Pierce County saw the median price stay the same, while the days on market increased. The major take away however, is the nominal amount of inventory that was available for potential Buyers of single family homes.
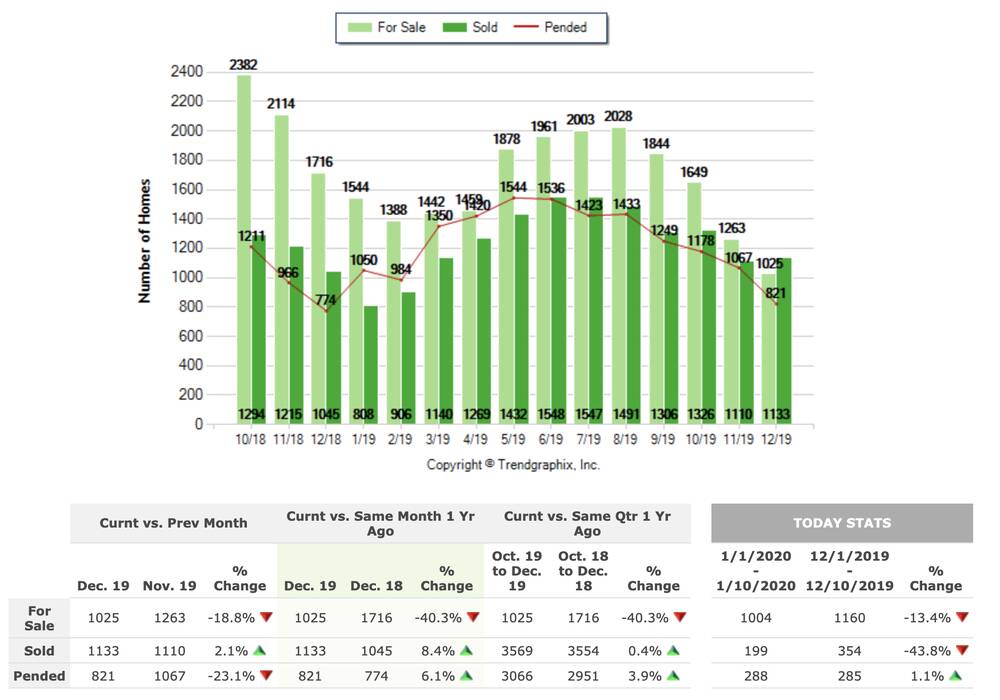
In the same month last year, there were 691 more properties on the market for buyers. In 2020, inventory was down 40.3%, leaving Buyers with almost half as many options on the market to choose from vs. the prior year. That’s a big difference! The inventory was also down 18.8% from November, the previous month.
Another statistic we look at when gauging the market (and determining whether it’s a Buyer or Seller’s market) is the ‘Months of Inventory’ (MOI). In a ‘balanced market,’ the MOI should hover between three to six; meaning if no more houses went on the market, it would take 3-6 months to absorb the current inventory. Below three is a Seller’s market, and above six is a Buyer’s market.
In the graph below, we take a look at the MOI versus the median price. You’ll notice that the lower the MOI, the higher the median price climbs (classic supply and demand).
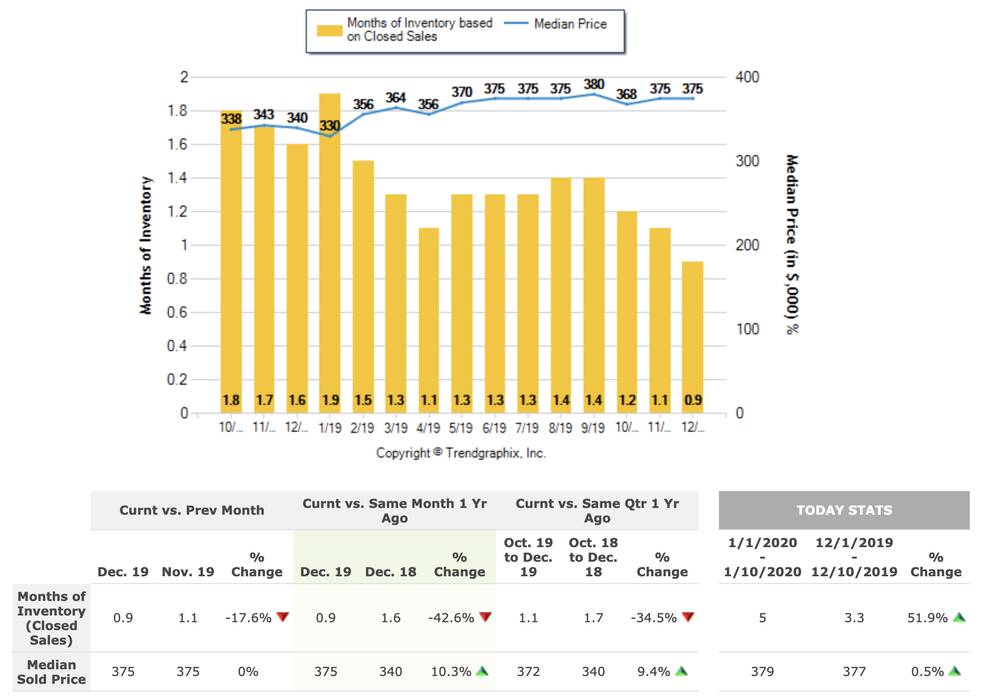
Something else you will notice, is a similar trend as seen in the graph above. In December of 2018, we had 1.6 months of inventory, in December of 2019, we were at 0.9 months of inventory… that leaves us down 42.6%.
TACOMA
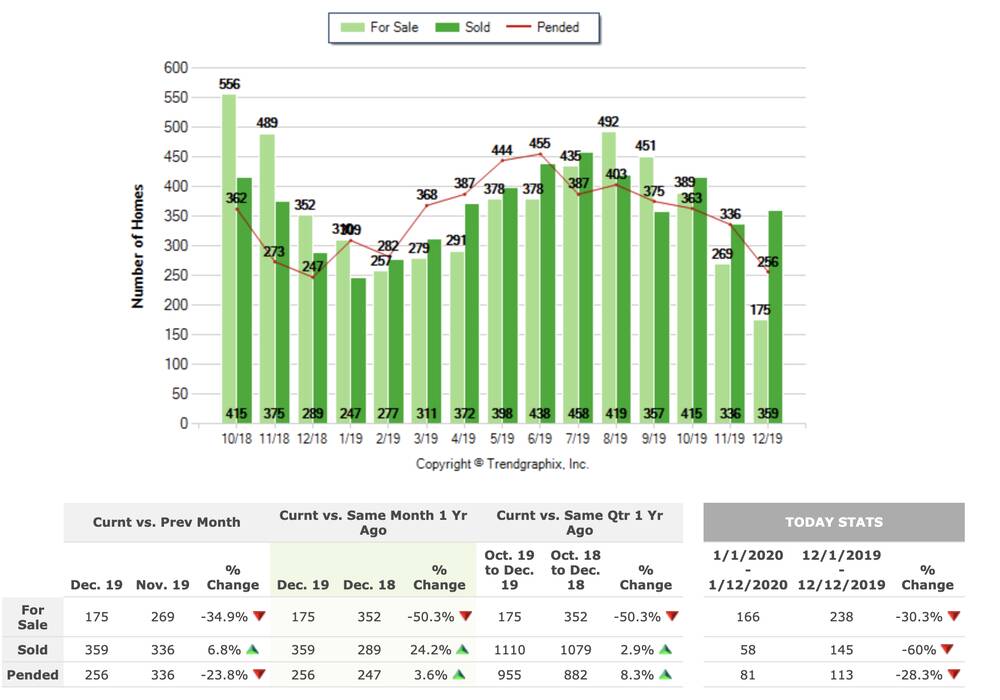
Tacoma is seeing the same trend in decreased inventory in December of 2019 and to begin 2020. Take a look at the graph below, which highlights the homes for sale vs sold:
First off, there are far more properties pending sale than on the market for sale. As far as number of homes on the market for sale, there were 177 more properties on the market in 2018; 50% more homes. One trend to look at is how many homes have been put on the market at the same day last month as this month (Jan ‘20). According to the graph, we are down 30% vs. this day last month. Maybe now that the Seahawks are out of the playoffs we’ll see this number rise?
When looking at the MOI, it dropped to 0.5 months in December, down from 1.2 at the same time last year. That means it remains a strong Seller’s market in Tacoma. Despite the drop in MOI from September, the median sales price in Tacoma remained steady during the last quarter of 2019.
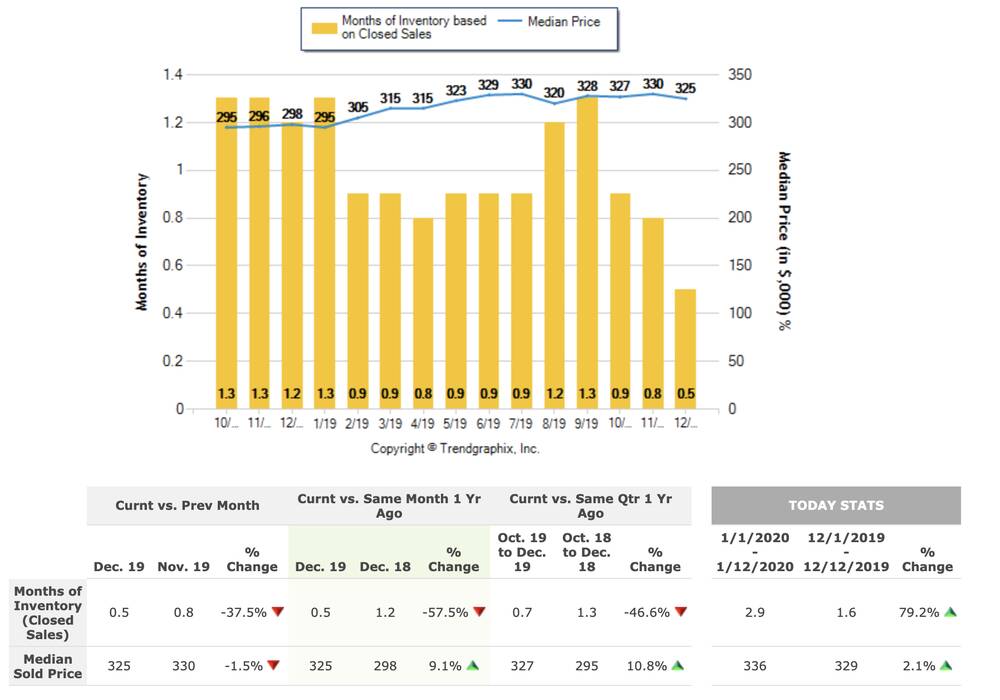
Another factor to consider is the 350k and under market in Tacoma. If you are in this market to buy a home, be patient! You are definitely going to see some competition. Take a look at the same graph below, focusing on the 350k and under pricepoint:
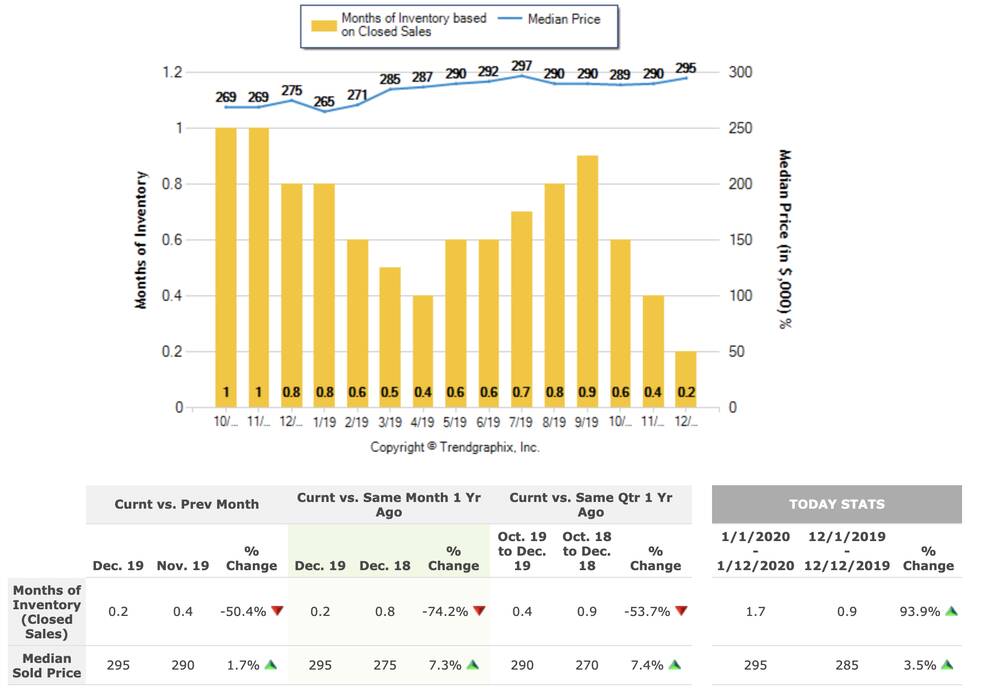
Yes you read that correct… under the 350k price point, the MOI dips to 0.2 months, which is a 74.2% drop from December of 2018. Yikes! However, the good news, is more homes have come on at this point (January 12th as of this post) in January of 2020, than in December 2019, which means we are adding much needed inventory to the market. Despite the efforts of sellers getting their homes on the market, the sellers still remain in control of the market.
Should you let these numbers discourage you if you are a buyer? Definitely not. This just means you need to be prepared for a competitive market. A good Realtor can help you develop a game plan and assemble the right team to make your goals a reality!
SUMMARY
In December we saw inventory shortages lower than the year prior. As we enter 2020, inventory is beginning to hit the markets, but will it be enough? Contact one of our Realtors for more information on the neighborhood you’re interested in! One thing is for sure, moving into 2020, Pierce County remains a popular place to call home. Let us know if we can help make that a reality for you this year!
TERMINOLOGY KEY
Chances of Selling - Pending properties over active properties. When there are more pending than actives, your chances of selling increase due to less homes on the market. Conversely, if there are more active homes than pending, buyers have more options, thus a ‘buyer’s market.’
Median days on market - ‘Days on Market’ is just that; how many days your home has been on the market.
Median Sales Price - The reasoning to use the median is the same here, with the sales price being self explanatory. The sales price indicates the median price of homes
Why use the median?
We utilize the median so the data can tell a close to real story, and the data isn’t skewed by outliers. For example, if you have 5 homes and one has been on for 125 days, while the four others have been on for 15 days, the outlier of the bunch (property that sat for 125 days on market) doesn’t skew the data set.